Cellular metabolism signaling
Cellular metabolism integrates glucose uptake and glycolysis, mitochondrial TCA/OXPHOS, glutamine and fatty-acid carbon routes, and branches such as the pentose phosphate pathway and nucleotide biosynthesis. AMPK and mTORC1 sense energy and nutrient availability; HIF programs bias glycolysis under hypoxia. Metabolic reprogramming couples to growth signaling, immune niches, and therapy resistance in cancer and chronic inflammation.
1. Key targets
Core nodes
- GLUT / HK / PFK / PKM
Glucose capture and flux control; isoforms like PKM2 route intermediates and can moonlight (context-dependent).
- PDH / TCA / ETC
Pyruvate entry and acetyl-CoA supply; ETC couples ATP generation with ROS and biosynthetic precursors.
- GLS / IDH / ACLY / FASN
Glutamine anaplerosis, α-KG/2-HG axes, citrate–acetyl-CoA shunt, and lipogenesis.
Sensing & integration
- AMPK: rising AMP/ADP, Ca2+, LKB1, etc.
- mTORC1: amino acids, glucose, growth factors, Rag/Rheb
- HIF1A: PHD–VHL–proteasome regulation
Outputs & transport
- LDH–lactate–MCT: NAD+ cycling and acidification
- NADPH: PPP, ME, one-carbon branches (model-dependent)
Supplement: metabolism-related targets (gene symbols)
Below the overview, HGNC symbols group glycolysis/glucose capture, pyruvate & TCA, OXPHOS & PPP, FAO & lipogenesis, glutamine anaplerosis & amino-acid transport, AMPK/mTOR/HIF sensing, and lactate/NAD balance. Validate isozymes, complex subunits, and model context with databases and papers.
Glucose uptake & glycolysis
PDH & TCA cycle
OXPHOS & PPP / one-carbon
Fatty-acid oxidation & lipogenesis
Glutaminase, anaplerosis & SLC transporters
AMPK, mTOR & HIF
2. Suggested experimental readouts
Combine flux (OCR/ECAR), stable-isotope tracing, and targeted proteomics; document dose, time, and cell-density dependence for metabolic probes.
- Seahorse OCR/ECAR with oligomycin, FCCP, rotenone/antimycin controls
- 13C6-glucose or 13C5-glutamine tracing for glycolysis/TCA/anaplerosis
- Extracellular lactate, glucose uptake (e.g., 2-NBDG), ATP/ADP (method-sensitive)
- p-AMPKα, p-ACC, p-S6K / p-S6 as mTORC1 readouts
- HK2, PKM2, LDHA, GLS, ACLY, FASN, IDH1/2 with fractionation as needed
3. Major carbon-route modules compared
| Module | Main roles | Typical readouts | Notes |
|---|---|---|---|
| Glycolysis | Rapid ATP, biosynthetic intermediates, lactate | ECAR, 13C-lactate, HK2/PKM2 | Aerobic glycolysis does not imply absent OXPHOS. |
| TCA / OXPHOS | Efficient ATP, precursors, NADH/FADH2 | OCR, 13C-glutamine TCA, TMRE | Pyruvate/glutamine in medium strongly shape phenotypes. |
| PPP | NADPH and nucleotide precursors | 6-AN (6-aminonicotinamide), 13C1-glucose branching trace | Distinguish oxidative vs non-oxidative arms. |
| Fatty-acid oxidation / lipogenesis | β-oxidation ATP/NADH; de novo FA synthesis and membrane lipids | Seahorse FAO substrates, CPT1 probes (etomoxir—off-target caveats), FASN/p-ACC | FAO dependence differs sharply across tumor vs liver models. |
| Glutamine anaplerosis | α-KG entry to TCA; biosynthesis & redox balance | 13C5-glutamine tracing, GLS inhibition (BPTES/CB-839), GOT1/2 | Glutamine addiction is not universal across cell lines. |
4. Tumor & niche: metabolic reprogramming
- Nutrient competition: Under glucose/glutamine limitation, tumor and immune metabolic preferences co-evolve.
- Lactate & acidity: MCT-mediated shuttling affects neighbor cell function and drug penetration.
- Metabolic therapy resistance: Bypass enzymes, mitochondrial plasticity, or autophagy can compensate single-node inhibition.
Metabolism-related antibodies (curated)
5. Product lines & on-site search
Primary & phospho antibodies
HK2, PFKL, ALDOA, PKM2, LDHA, GLUT1, MCT1/4, PDK1, PDH, IDH1/2, ACLY, FASN, GLS, AMPKα, p-AMPK, mTOR, p-S6K, p-S6, HIF1α—WB/IHC/IF/FC per clone.
Recombinant proteins / enzymes
Recombinant HK, LDH, glutaminase for in vitro assays or pulldowns (availability-dependent).
Assays & kits
Glucose uptake, lactate, ATP, NAD/NADH kits—follow datasheets and ethics.
6. Inhibitors & tool compounds (summary)
For research use; follow lab SOP and datasheets. Some entries are flux probes rather than therapeutics.
HK substrate analog; common glycolysis flux probe.
ATP synthase inhibitor; Seahorse OCR control.
GLS inhibitors; glutamine-addicted models.
CPT1/FAO probe (off-target caveats).
Complex I–linked effects; AMPK-context studies.
mTORC1 inhibition; watch PI3K/Akt feedback.
LDH tool; lactate/NAD+ balance experiments.
Mutant IDH1 inhibitors (project/regulatory dependent).
7. Pathway schematic
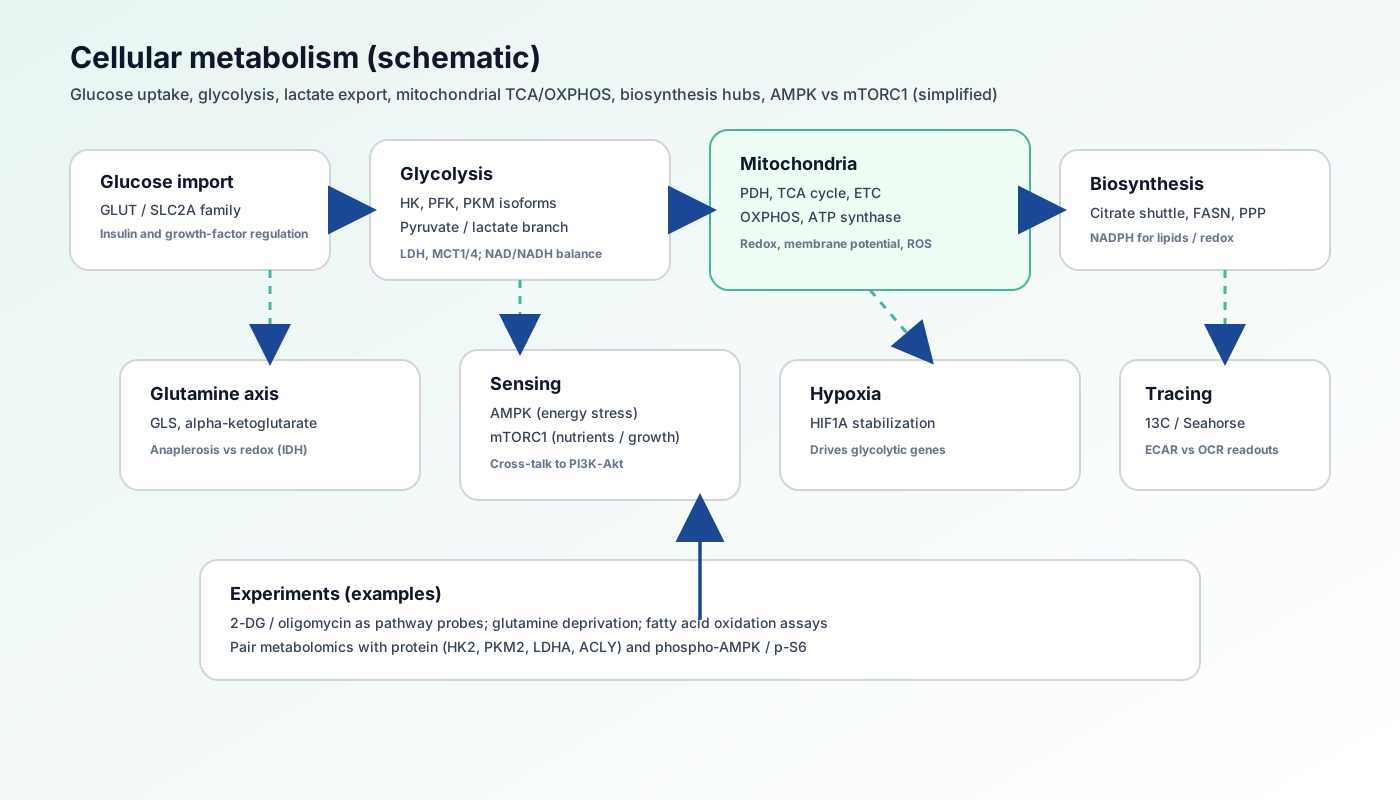
- Glucose import, glycolysis, pyruvate–lactate branch
- Mitochondrial TCA/OXPHOS couples ATP and ROS
- Glutamine anaplerosis and IDH nodes shape α-KG/2-HG
- AMPK and mTORC1 integrate nutrients and growth
8. Pathway biology overview
Metabolic networks are not isolated housekeeping—they intersect chromatin regulation, checkpoints, and immune receptor signaling; single proteins can moonlight between cytosolic and nuclear roles.
- Tissue/cell type sets baseline flux—extrapolate cautiously across models
- Culture conditions (serum, O2, substrates) dominate metabolic phenotypes
9. Related pathways on this site
10. External databases & modification resources
11. References
Classics in cancer metabolism
- • Warburg O. (1956). Science. 123(3191):309-14.
- • Vander Heiden MG, Cantley LC, Thompson CB. (2009). Science. 324(5930):1029-33.
Integration & reviews
- • DeBerardinis RJ, Thompson CB. (2012). Cell. 148(6):1132-44.
- • Martinez-Reyes I, Chandel NS. (2020). Nat Rev Mol Cell Biol. 21(12):710-27.